3.2
The role of electrification in the decarbonised future
Electrification plays a central role in all deep decarbonisation scenarios of end-use sectors by major institutions.3 To reach the global decarbonisation goals, the share of electricity in total final consumption needs to reach almost 40% in the IEA Announced Pledges Scenarios (APS) and surpass 50% by 2050 in the IEA Net Zero Emissions by 2050 (NZE) Scenario (Figure 3.5). This latter share increases to two-thirds if the useful energy4 consumed by end users is considered and to over three-quarters if indirect electrification through hydrogen is also included.
Global electrification at TFC level over 2010‑2020 increased at an annual average growth rate of 1.6%, compared with 1.3% over the 2010‑2019 period. However, in the NZE Scenario to meet climate targets, a growth rate of electrification of 3.3% over 2020‑2050 is required, or twice the rate of that observed over 2010‑2020.
The leap from 2019 to 2020 occurs thanks to the growth of 0.8 percentage points and would represent a growth compatible with the rate required to reach the NZE Scenario of the IEA. But as noted previously, this apparent electrification growth in 2020 is primarily due to the overall decrease of energy demand, which is driven by a substantial reduction of oil products in the transport sector, which is expected to rebound in 2021 and 2022.
When looking at the individual sectors, the individual growth rates are much lower, and are often not representative of a real trend due to the temporary decline of both electricity and overall energy demand. The low increase of electrification by sector and the increased ambitions in the NZE Scenario by 2050 therefore result in more stringent needs and more urgent action required to pursue further electrification.
The “space-for-action” through electrification5 – presented and defined in GEM 2022 and updated in this report – represents the overall potential for electrification that is available in each sector (buildings, transport and industry) once the direct use of renewables and hard-to-abate sectors have been accounted for (Figure 3.6). The actual portion of the potential that can effectively be realised depends on several factors, including the deployment of other fuels (e.g. solar heaters in the buildings sector), policy targets, market regulation, creating a level playing field with other energy sources (e.g. with natural gas), and minimising barriers to the deployment of electricity-based technologies (e.g. access to financing). Successfully exploiting this potential can bring important social, economic and environmental benefits and increase the overall efficiency of the energy system.
The space-for-action is analysed for each of the 15 countries and for each sector and subsector. The related indicators are presented in the individual country profiles in Chapter 5, together with several other key performance indicators that are useful to determine the current status and the evolution of electrification in each sector and country. The four “space-for-action” indicators are also shown in Table 3.1 for the major regions and in Table 5B for each of the 15 countries analysed.
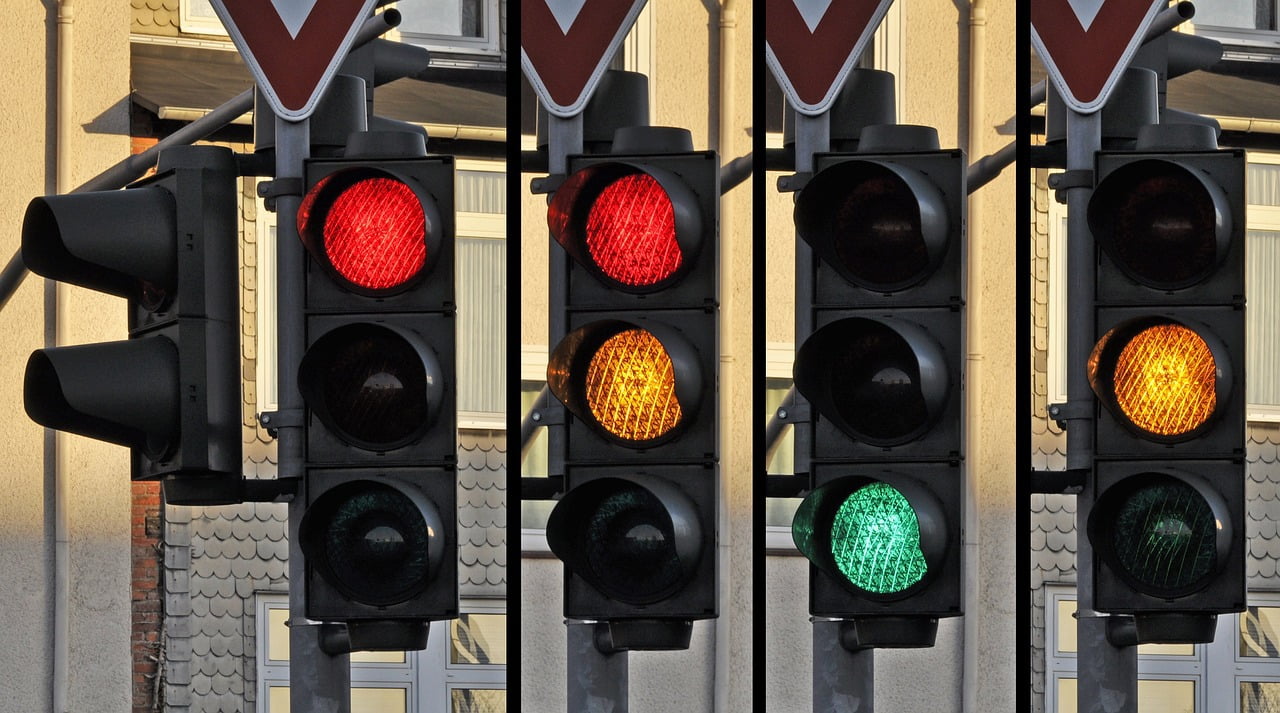
The indicators presented in these two tables include the four indicators related to the share of electricity (in TFC, and in the totals of the buildings, transport and industry sectors), the proportion of low-carbon technologies in total electricity generation, the emissions intensity of power generation, and the four indicators associated with the space-for-action (in TFC, and in the totals of the buildings, transport and industry sectors). The “traffic lights” presented are the result of the comparison between the growth rates required over the next decade (2020‑2030) to achieve the levels of the IEA APS, or of the IEA NZE Scenario for the world, with the growth rate of each indicator over the past decade (2010‑2020). These two tables were presented in GEM 2022 and they are updated here to include 2020. In this latest edition, the comparison with IEA trends related to the Sustainable Development Scenario (SDS) have now been substituted with those of the APS (see footnote 3). The main changes in the overall table with respect to last year can be summarised as follows:
Several of the formerly decreasing trends changed direction, now growing towards higher electrification. Among the first four indicators representing share of electrification, we observe that last year there were six sectors that “need to reverse trend” (red triangle) compared with only three this year.
The two main indicators linked to the decarbonisation of power generation (the proportion of low-carbon electricity generation and the carbon dioxide (CO2) emissions per unit of electricity generation) did not change significantly, with a small amelioration for the former at global level for the APS and for the latter in North America.
The space-for-action indicators saw the highest degree of change, generally due to the low degree of utilisation of the potential by sector in 2020.
It should be noted that these improvements could be due to the atypical year of 2020, and that for some regions the APS is not as ambitious as the SDS. Overall, most of the trends are not in line with the ambitions of the pledges, and this situation would be significantly worse in the NZE Scenario. Asia-Pacific remains the region with the highest level of green and yellow lights. As this region remains dominated by the trends in China, the slowdown of electrification observed in 2020 in this country could have significant implications for the overall regional trends.
3 In GEM 2022, the evolution of the historical electrification indicators was compared with the evolution needed in the Sustainable Development Scenario and the Net Zero Emissions by 2050 Scenario presented in the International Energy Agency (IEA) World Energy Outlook (WEO) 2021. In GEM 2023, the evolution of the electrification indicators is compared with the evolution needed in the Announced Pledges Scenario and the Net Zero Emissions by 2050 Scenario presented in the IEA WEO 2022, reflecting the change of scenarios presented in the latest WEO.4 See section 3.5 for the definition of useful energy.
5 Excluding indirect electrification through the use of hydrogen and hydrogen-based fuels.